Plotting kde1d objects
Arguments
- x
kde1dobject.- ...
further arguments passed to
plot.default()
Examples
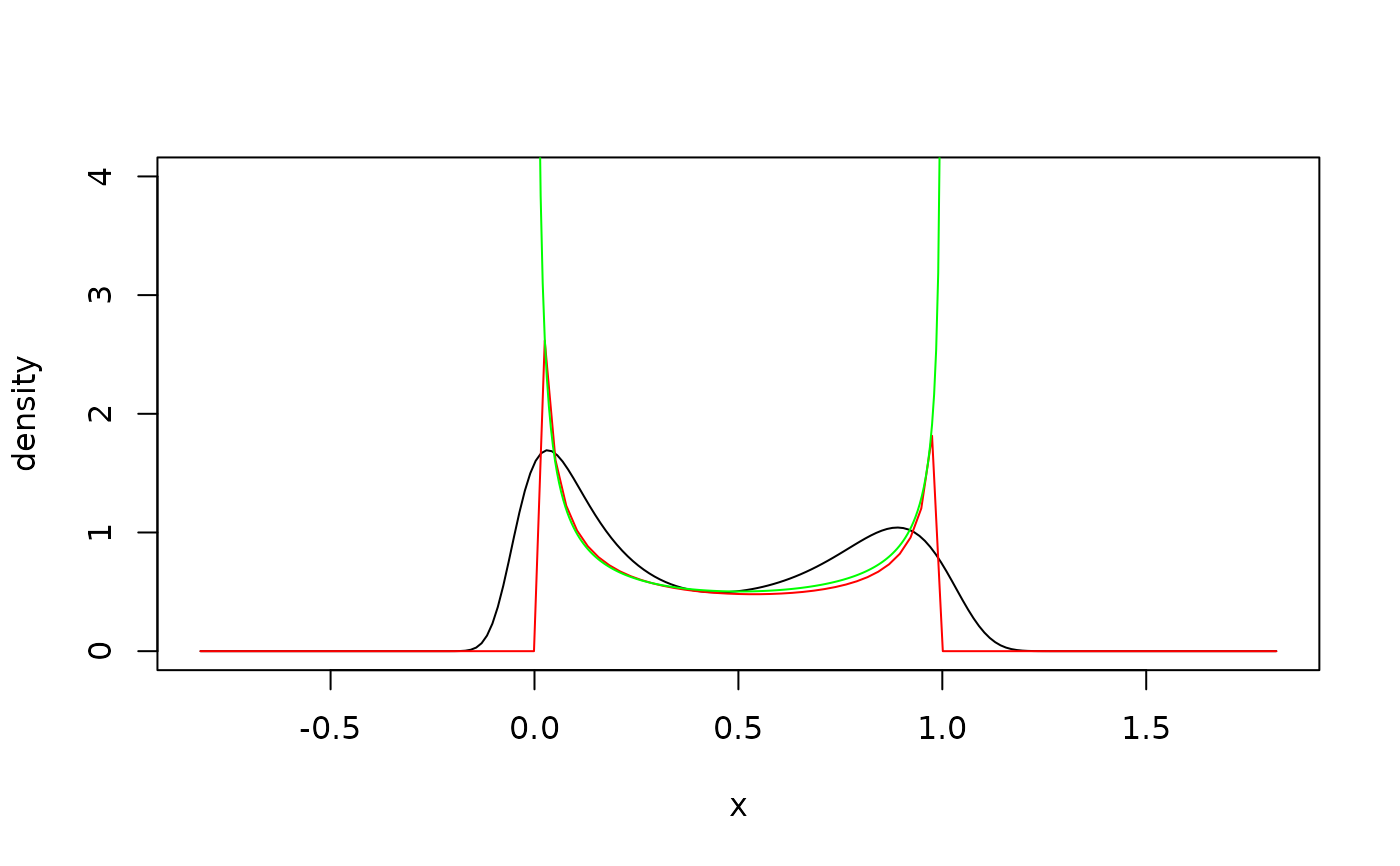
## continuous data
x <- rbeta(100, shape1 = 0.3, shape2 = 0.4) # simulate data
fit <- kde1d(x) # unbounded estimate
plot(fit, ylim = c(0, 4)) # plot estimate
curve(dbeta(x, 0.3, 0.4), # add true density
col = "red", add = TRUE
)
fit_bounded <- kde1d(x, xmin = 0, xmax = 1) # bounded estimate
lines(fit_bounded, col = "green")
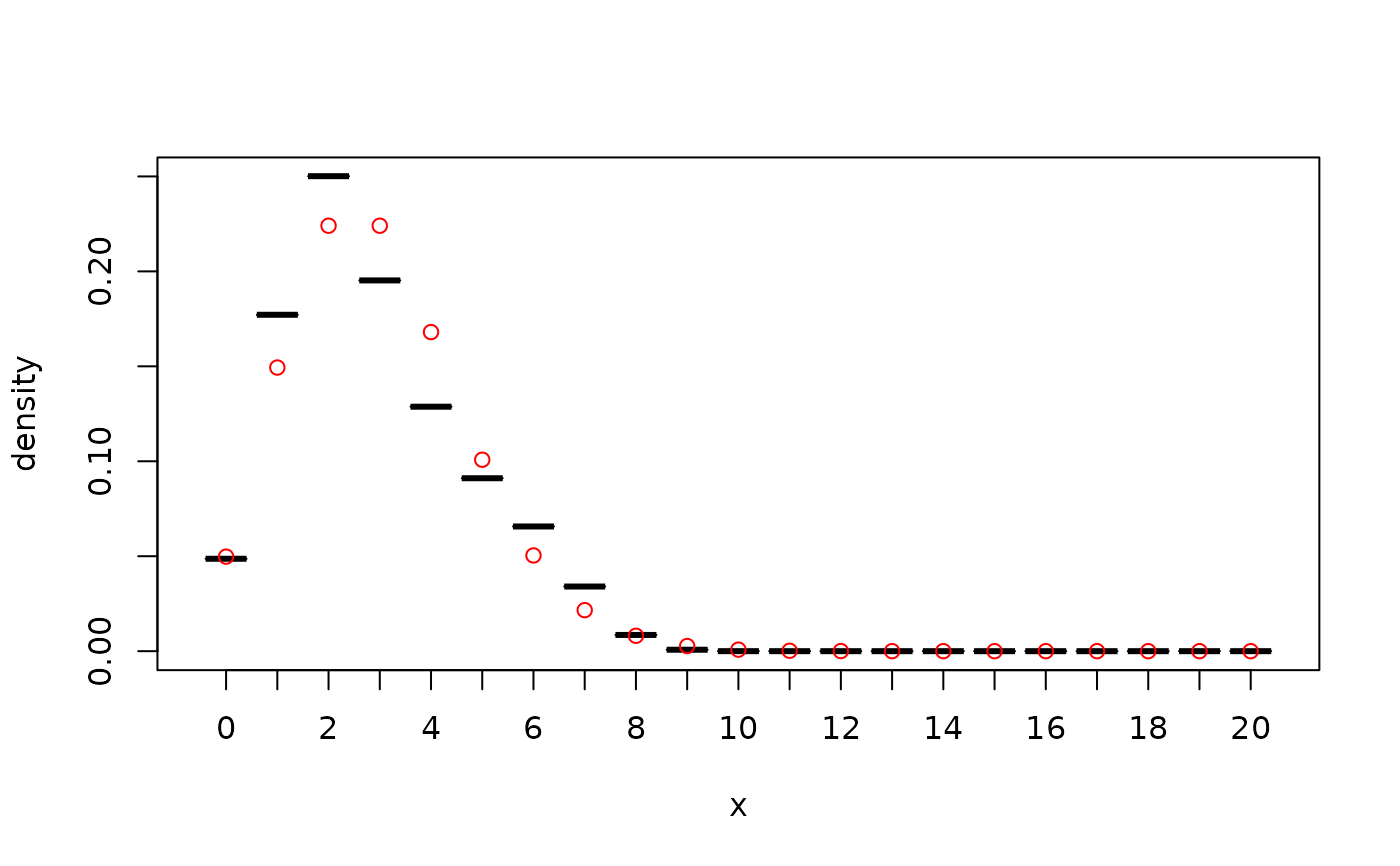
 ## discrete data
x <- rpois(100, 3) # simulate data
x <- ordered(x, levels = 0:20) # declare variable as ordered
fit <- kde1d(x) # estimate density
plot(fit, ylim = c(0, 0.25)) # plot density estimate
points(ordered(0:20, 0:20), # add true density values
dpois(0:20, 3),
col = "red"
)
## discrete data
x <- rpois(100, 3) # simulate data
x <- ordered(x, levels = 0:20) # declare variable as ordered
fit <- kde1d(x) # estimate density
plot(fit, ylim = c(0, 0.25)) # plot density estimate
points(ordered(0:20, 0:20), # add true density values
dpois(0:20, 3),
col = "red"
)
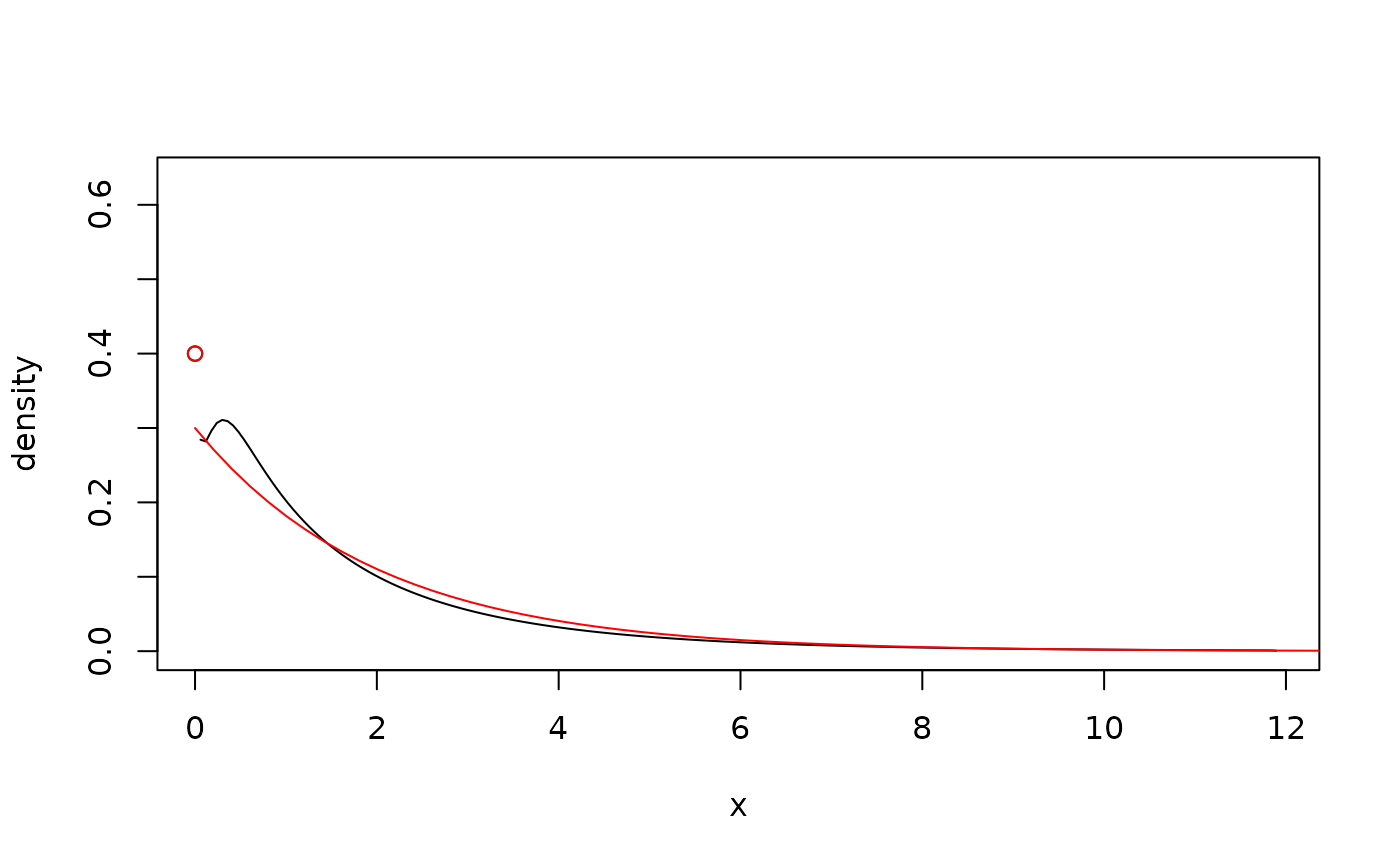
 ## zero-inflated data
x <- rexp(500, 0.5) # simulate data
x[sample(1:500, 200)] <- 0 # add zero-inflation
fit <- kde1d(x, xmin = 0, type = "zi") # estimate density
plot(fit) # plot the density estimate
lines( # add true density
seq(0, 20, l = 100),
0.6 * dexp(seq(0, 20, l = 100), 0.5),
col = "red"
)
points(0, 0.4, col = "red")
## zero-inflated data
x <- rexp(500, 0.5) # simulate data
x[sample(1:500, 200)] <- 0 # add zero-inflation
fit <- kde1d(x, xmin = 0, type = "zi") # estimate density
plot(fit) # plot the density estimate
lines( # add true density
seq(0, 20, l = 100),
0.6 * dexp(seq(0, 20, l = 100), 0.5),
col = "red"
)
points(0, 0.4, col = "red")